
Stop taking Omega 3 on blind faith.
The useful question is not whether you take fish oil. It is whether enough EPA and DHA are actually making it into your body, and whether your blood levels are moving in the right direction.
A commonly referenced higher Omega 3 Index zone for red blood cell EPA + DHA.
Weeks is a sensible timeframe before judging whether a consistent routine is changing longer term status.
Daily EPA + DHA protocol target used by the Omega 3 intake checker below.
Omega 3 becomes part of the structure of your cells.
EPA and DHA are long chain omega 3 fatty acids that become incorporated into cell membranes. DHA is especially concentrated in the brain and retina, while EPA is involved in pathways that generate lipid signalling molecules.
That is one reason blood status matters. A supplement label tells you what went into the bottle. It does not tell you what ended up in your red blood cells.
Heart
EPA and DHA have established roles in cardiovascular physiology, including triglyceride metabolism at higher intakes.
Brain
DHA is a major structural fatty acid in neural tissue and contributes to normal brain and visual function.
Cell membranes
Red blood cell EPA + DHA gives a longer term biomarker of omega 3 status than simply asking what you ate today.
ALA, EPA and DHA are not interchangeable.
All three are omega 3 fatty acids, but they enter the body through different routes and should not be treated as the same number on a label.
ALA
Found in foods such as flax, chia and walnuts. Humans can convert ALA into longer chain omega 3s, but conversion to EPA and especially DHA is limited and highly variable.
EPA
Found mainly in oily fish, seafood and marine or algal supplements. EPA is counted directly when assessing your EPA + DHA intake.
DHA
Found mainly in oily fish, seafood and algae. DHA is a major structural component of the brain and retina and is also counted directly.
Read the back of the bottle.
A large “1,000 mg fish oil” claim on the front can be misleading if the actual combined EPA + DHA content is much lower.
- Find EPA per daily serving.
- Find DHA per daily serving.
- Add those two numbers together.
- If you know it, use that figure in the advanced checker option below.
Most Omega 3 routines fail before the first capsule is swallowed.
Not because omega 3 is useless, but because the inputs are vague and the outcome is rarely measured.
Counting fish oil, not EPA + DHA
Total oil weight and active long chain omega 3 content are not the same thing. The EPA + DHA figure is the useful number.
Assuming the same dose works for everyone
Supplement response varies. Dose, starting blood level and formulation all influence how much the Omega 3 Index changes.
Never checking the result
Even a strong intake pattern cannot prove your blood status. That requires a fatty acid blood test.
The best Omega 3 foods at a glance.
Marine foods provide preformed EPA and DHA directly. Plant foods provide ALA, which is valuable, but it is not the same as eating EPA and DHA directly.
Highest direct sources
Representative combined EPA + DHA values, standardised per 100 g so the foods are easy to compare.
Best plant Omega 3 foods
Approximate ALA values standardised to the same 30 g comparison weight. This makes the foods easier to compare, but 30 g is not intended as a recommended serving size for every item.
What does your typical week of Omega 3 actually add up to?
Pick the fish and seafood you normally eat. The checker estimates your weekly EPA + DHA intake, converts it into a daily equivalent for easy comparison, then shows why a blood test is still the only way to know your actual Omega 3 status.
Start with foods, not milligrams. Most people do not know their EPA and DHA intake, so this version works backwards from the foods you recognise. If you already know your numbers, switch to the direct entry option.
Build your typical week
Use the plus and minus buttons to add the servings you normally eat in a week. We show both your weekly EPA + DHA total and the daily equivalent average, so the comparison is clear.
Build your known EPA + DHA intake
Enter the EPA and DHA you consume on a day you take your supplement or known dose. We average it across the week, so an occasional dose is not accidentally treated as a daily one.
Blood testing shows what an intake estimate cannot.
The conventional Omega 3 Index measures EPA + DHA in red blood cells. Zinzino's BalanceTest reports its Omega 3 Index from a whole blood sample. Because different testing methods and sample types can use different reference ranges, the result should be interpreted using the ranges supplied with the specific test.
The 4% and 8% zones come from conventional red blood cell Omega 3 Index research and are not a diagnosis. Zinzino's BalanceTest uses whole blood and provides its own reference ranges in the report.
More useful than a single number.
The BalanceTest measures 11 fatty acids and presents six markers designed to help you understand your fatty acid profile.
Why testing changed our approach.
A diet can look rich in Omega 3 on paper and still leave an important question unanswered: what is actually showing up in your blood?
When we first tested my wife, I expected her Omega 3 status to look fairly good. She was eating walnuts and chia seeds every day and oily fish a couple of times each week. On paper, that looked like a strong Omega 3 diet. At the same time, she was experiencing physical signs of increased inflammation and was in the early stages of Hashimoto's disease, which runs on the female side of her family.
The test gave us something objective to work from. Her fatty acid balance was much further from the target range than we expected, despite those healthy food choices. We then moved to the higher Omega 3 protocol described on this page, including Zinzino BalanceOil, and kept the routine consistent.
Within three months, her follow-up fatty acid test had moved back into the target ranges shown below. At a later follow-up, the thyroid antibody markers being monitored in relation to Hashimoto's were lower, her skin and hair quality had improved, and the physical signs of inflammation we had noticed had reduced.
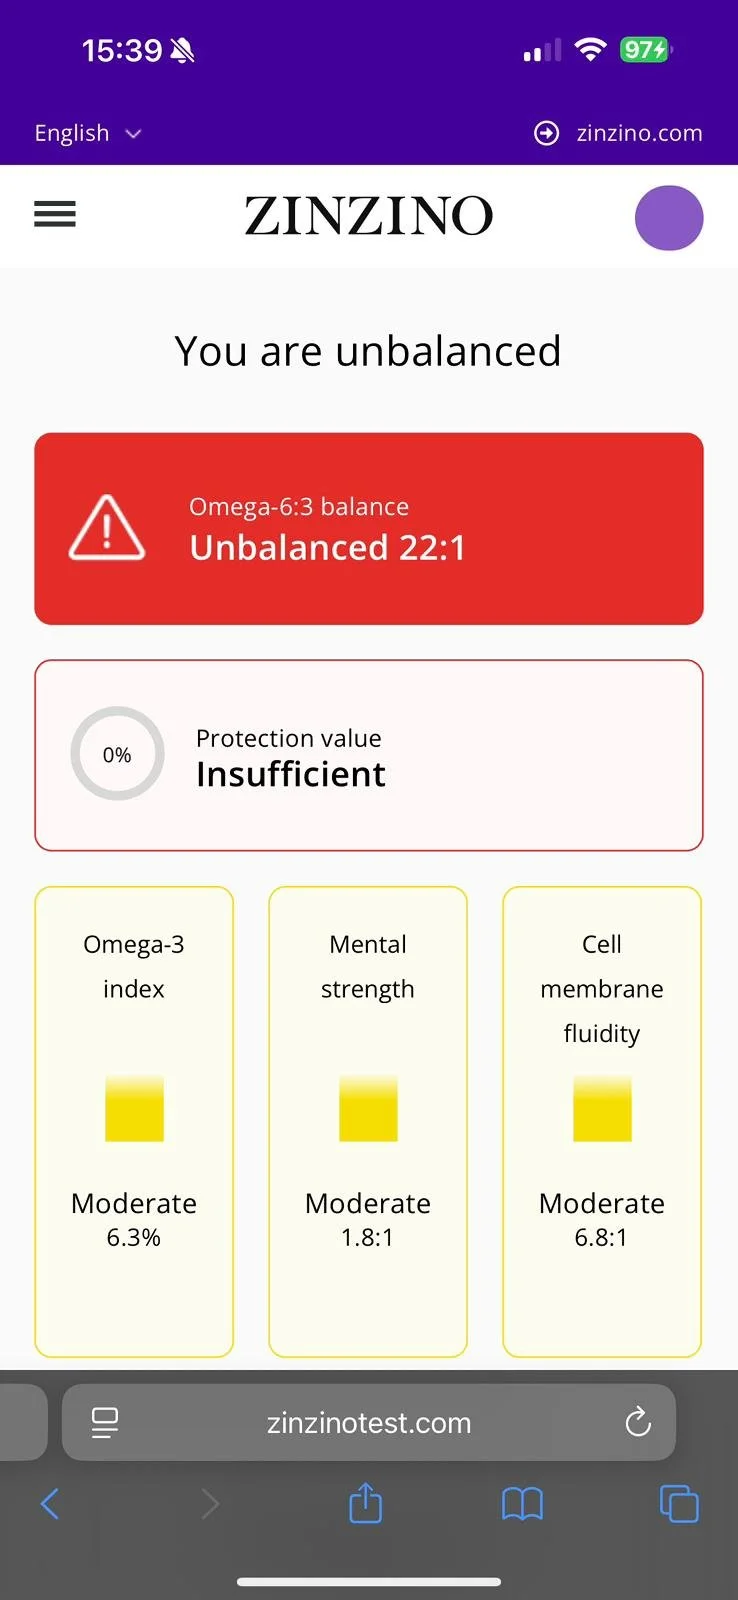
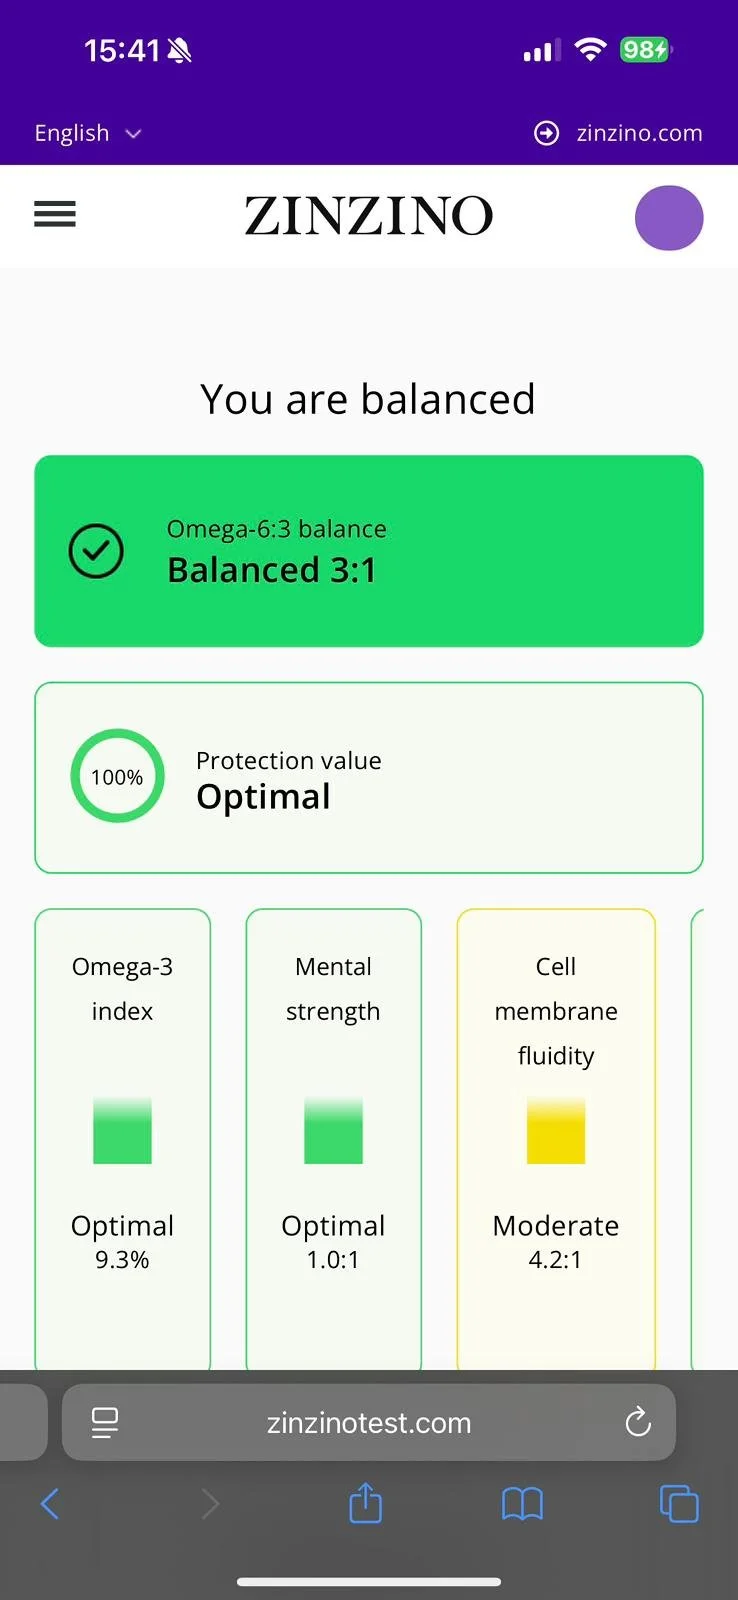
This is one personal experience, not evidence that Omega 3 or BalanceOil treated Hashimoto's disease or caused the changes described. Individual responses vary, and thyroid disease requires appropriate medical assessment and follow-up.

A test first approach to Omega 3.
I prefer a system where you can establish a baseline, follow a consistent routine, then retest and see whether your fatty acid profile actually changed.
Zinzino's BalanceOil Kit with Test combines the oil with testing, which makes the feedback loop far more useful than buying another bottle and hoping for the best.
- BalanceTest included in the linked kit.
- Daily serving provides EPA and DHA rather than relying on ALA conversion.
- Fish oil is combined with extra virgin olive oil containing polyphenols.
- The test is analysed by an independent laboratory in Oslo.
I am an independent Zinzino partner and may receive a benefit if you purchase through my referral link. Check the current product page for live pricing, subscription terms and contents.
Stop guessing what your Omega 3 is doing.
A good routine improves the odds. A blood test gives you clarity. Establish your baseline, make the change, then retest and see what happened.
Educational information only and not medical advice. The Omega 3 Intake Index is a custom educational scoring tool, not a validated diagnostic instrument, clinical risk score or substitute for laboratory testing. If you are pregnant, have a medical condition, take anticoagulant medication or are considering high dose omega 3, speak with an appropriately qualified healthcare professional.
FAQ.
The aim is to make Omega 3 measurable without turning nutrition into fake precision.
Can the checker tell me my Omega 3 Index?
How much EPA + DHA should I take?
Do chia seeds and flax count?
Why wait before retesting?
Is the Omega 6 to 3 ratio the only thing that matters?
Walker et al., 2019: predicting change in the Omega 3 Index
Researchers pooled 1,422 participants from 14 intervention trials. Supplemental EPA + DHA dose, baseline Omega 3 Index and supplement chemical form were the significant predictors in the final model, but substantial individual variation remained. This is the main reason the calculator above estimates intake rather than inventing a laboratory result.
Read the study ↗Flock et al., 2013: dose response randomised controlled trial
In a randomised dose response trial, EPA + DHA supplementation produced dose dependent changes in red blood cell omega 3 content. Dose explained most of the variation, while body weight and other individual factors contributed additional information.
Read the study ↗Harris et al., 2007: fish and fish oil both raise red blood cell EPA + DHA
This controlled feeding study showed that oily fish and fish oil capsules can both increase red blood cell EPA + DHA when they provide comparable long chain omega 3 intake.
Read the study ↗Jackson et al., 2019: fish intake, supplements and Omega 3 Index
In a large observational dataset, higher fish intake and EPA + DHA supplement use were both associated with a higher Omega 3 Index. The authors found that diet alone did not reliably place everyone into the higher index range.
Read the study ↗McBurney et al., 2021: fatty acid profile and mortality in the Framingham cohort
In the Framingham Offspring Cohort, red blood cell fatty acid measures including long chain omega 3s contributed to mortality prediction. The results are observational, so they show association rather than proving that raising omega 3 alone adds a fixed number of years to life.
Read the study ↗Bannenberg et al., 2017: fish oil oxidation and label quality
A 47 product New Zealand analysis found most products met regulatory oxidation and EPA/DHA label requirements, although not all met stricter voluntary limits. This is more balanced than claiming that nearly all fish oil is rancid or ineffective.
Read the study ↗